Create a Self-Hosted Status Page in 10 Minutes
Status pages are the public face of your reliability. When customers see something broken, the first thing they check is your status page. But most status page providers charge monthly fees, host your data on their servers, and give you limited control over branding and presentation. CPI-Control lets you create a fully self-hosted status page that runs on your own infrastructure, uses your own domain, and is powered by real monitoring data rather than manually toggled statuses.
Why Self-Hosted?
There are several compelling reasons to host your own status page. First, there's no vendor lock-in. Your status page doesn't depend on a third-party service being up — which is ironic when you think about it, because your status page provider going down means your customers can't check if you are down. Second, you get complete control over your domain. The page lives at status.yourdomain.com, not yourdomain.statuspage.io. Third, the data stays yours. Uptime percentages, response times, and incident history are stored on your server, not in someone else's database. And fourth, it's free — there's no per-page or per-service fee because the monitoring agent is a single binary running on a server you already pay for.
Step 1: Install the Monitoring Agent
The CPI-Control monitoring agent is a single Go binary that runs on any Linux server. You can install it on the same server that hosts your application or on a dedicated monitoring server. Download the latest release from the CPI-Control releases page and place it in /usr/local/bin/. Then create a systemd service file to ensure it starts automatically and restarts on failure.
The agent binary is under 15 MB and uses minimal resources — typically under 20 MB of RAM and negligible CPU. It runs an HTTP server for serving the status page and a background process for executing health checks. The agent communicates with CPI-Control on your desktop to receive configuration updates, but it operates independently for serving the status page. If your desktop is off, the status page keeps running with the last known configuration.
Step 2: Register the Agent in CPI-Control
Open CPI-Control on your desktop and navigate to Settings → Agents → Add Agent. Enter the IP address or hostname of the server where you installed the agent, along with the SSH credentials CPI-Control will use to push configuration updates. CPI-Control verifies the connection and confirms the agent is running. Once registered, the agent appears in your agents list with its status, uptime, and the number of status pages it's serving.
You can register multiple agents across different servers and regions. Each agent can serve multiple status pages, and you can assign specific agents to specific status pages for geographic redundancy. If you have servers in Europe and the US, you can run an agent on each and have your status page served from the region closest to your customers.
Step 3: Create a Status Page
In CPI-Control, go to the Status Pages section and click Create New. Give your status page a name — this is the internal name you'll use to identify it, not the public title. Select the agent that will serve this page. Then enter the domain where the status page will be accessible, like status.yourdomain.com. Make sure your DNS records point this domain to the server running the agent.
Step 4: Configure Branding
CPI-Control gives you full control over the appearance of your status page. Upload your company logo, set your company name, choose a primary color that matches your brand, and select one of three available themes. The Dark theme features a deep navy background with subtle gradients, ideal for technical products and developer tools. The Light theme uses a clean white background with soft shadows, suitable for business-facing applications. The Minimal theme strips away all decoration for a no-frills, data-focused presentation.
Each theme is responsive and optimized for both desktop and mobile viewing. Your customers will get a professional experience regardless of how they access the page. The branding settings are applied instantly — you can preview changes in real time before publishing.
Step 5: Select Services to Display
Not every service you monitor should appear on your public status page. CPI-Control lets you choose exactly which services to display. You can select individual services or entire projects. For each displayed service, you can customize the public name — so an internal service called "api-gateway-prod-v2" can appear as "API" on the status page. You can also group services into categories like "Core Platform", "Integrations", and "Developer Tools" to organize the page logically.
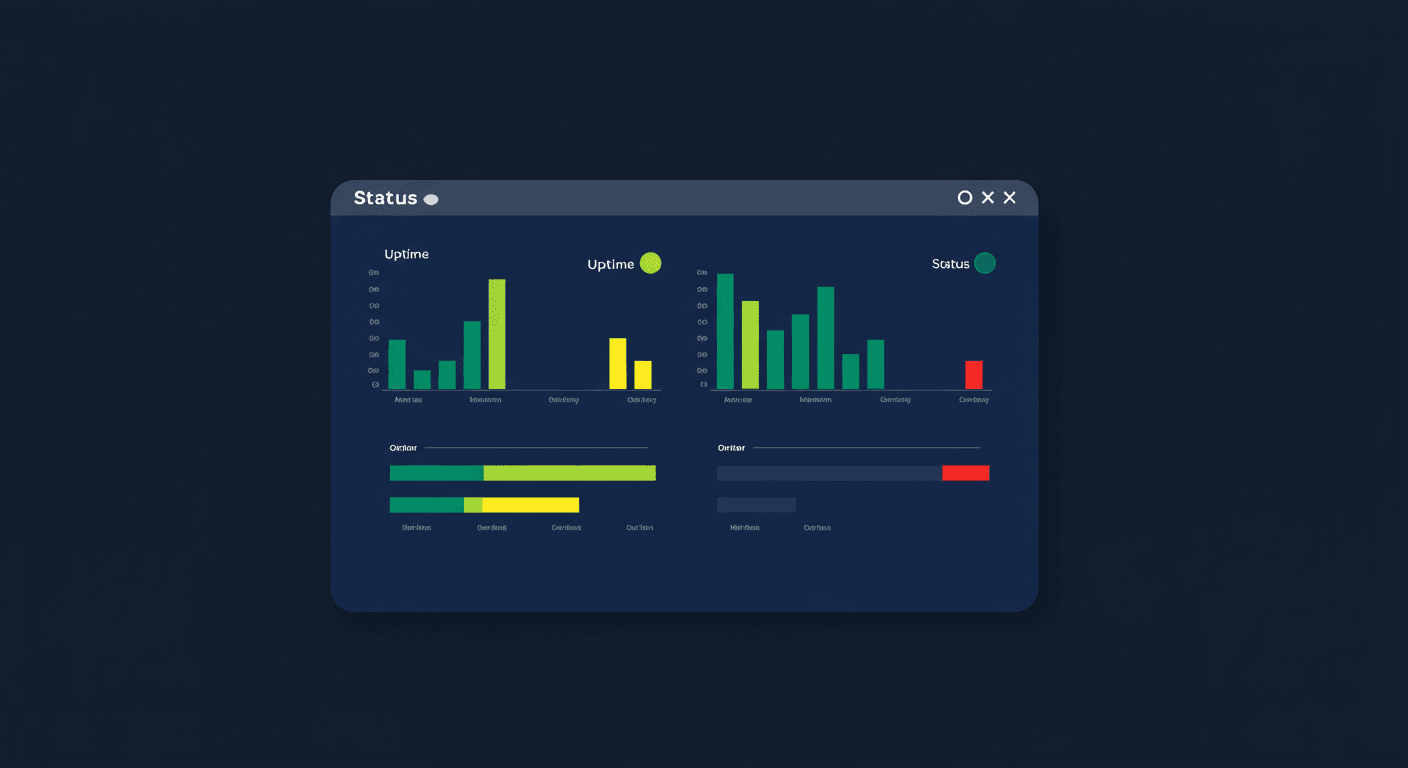
The order of services and groups is fully draggable. Place your most critical services at the top where customers will see them first. Each service on the status page shows its current status (Operational, Degraded, or Down), a 90-day uptime bar chart with daily resolution, and the current response time from the most recent health check.
Step 6: Deploy
When you're satisfied with the configuration, click Deploy. CPI-Control pushes the status page configuration to the selected agent via SSH. The agent picks up the new configuration, generates the static page assets, and starts serving the status page on port 443. The entire deployment takes under 10 seconds. Any future changes to the status page — adding services, updating branding, modifying groups — can be redeployed with a single click.
Automatic HTTPS with Let's Encrypt
The monitoring agent handles TLS certificate provisioning automatically using Let's Encrypt. When you deploy a status page with a custom domain, the agent requests a certificate for that domain, validates ownership via HTTP-01 challenge, and installs the certificate — all without any manual intervention. Certificates are automatically renewed before expiration. You don't need to install certbot, configure nginx, or set up a reverse proxy. The agent serves HTTPS directly on port 443.
For this to work, port 443 on your server must be accessible from the internet, and the domain must point to the server's IP address. If you're running behind a load balancer or CDN, you can alternatively provide your own certificate files.
The Result
After following these steps, you have a professional status page running on your own infrastructure. It displays real-time health data from your actual monitoring setup — not manually toggled statuses that someone forgets to update. When a service goes down, the status page reflects it automatically within seconds. When it recovers, the page updates again. Uptime bars show accurate historical data because they're calculated from real health check results, not from manually logged incidents.
The page also includes an incident history section that automatically generates entries when services experience downtime. Each incident shows the affected services, the duration of the outage, and the timeline of status changes. You can optionally add manual incident notes for context — explaining what went wrong and what was done to fix it — but the basic incident tracking is fully automatic.
Three themes, zero monthly cost, complete data ownership, and a deployment process that takes less time than signing up for a hosted status page service. Your customers see a polished, branded page at your domain, backed by real monitoring data.