Health Monitoring

Health Monitoring That
Works Out of the Box

Automatic health checks, incident detection, and recovery — without a cloud account or monthly fee.

CPI-Control incident detail view showing automatic detection, response body capture, and timeline
Built-in health monitoring with automatic incident detection, response body capture, and push notifications
Configuration

Configurable HTTP Checks

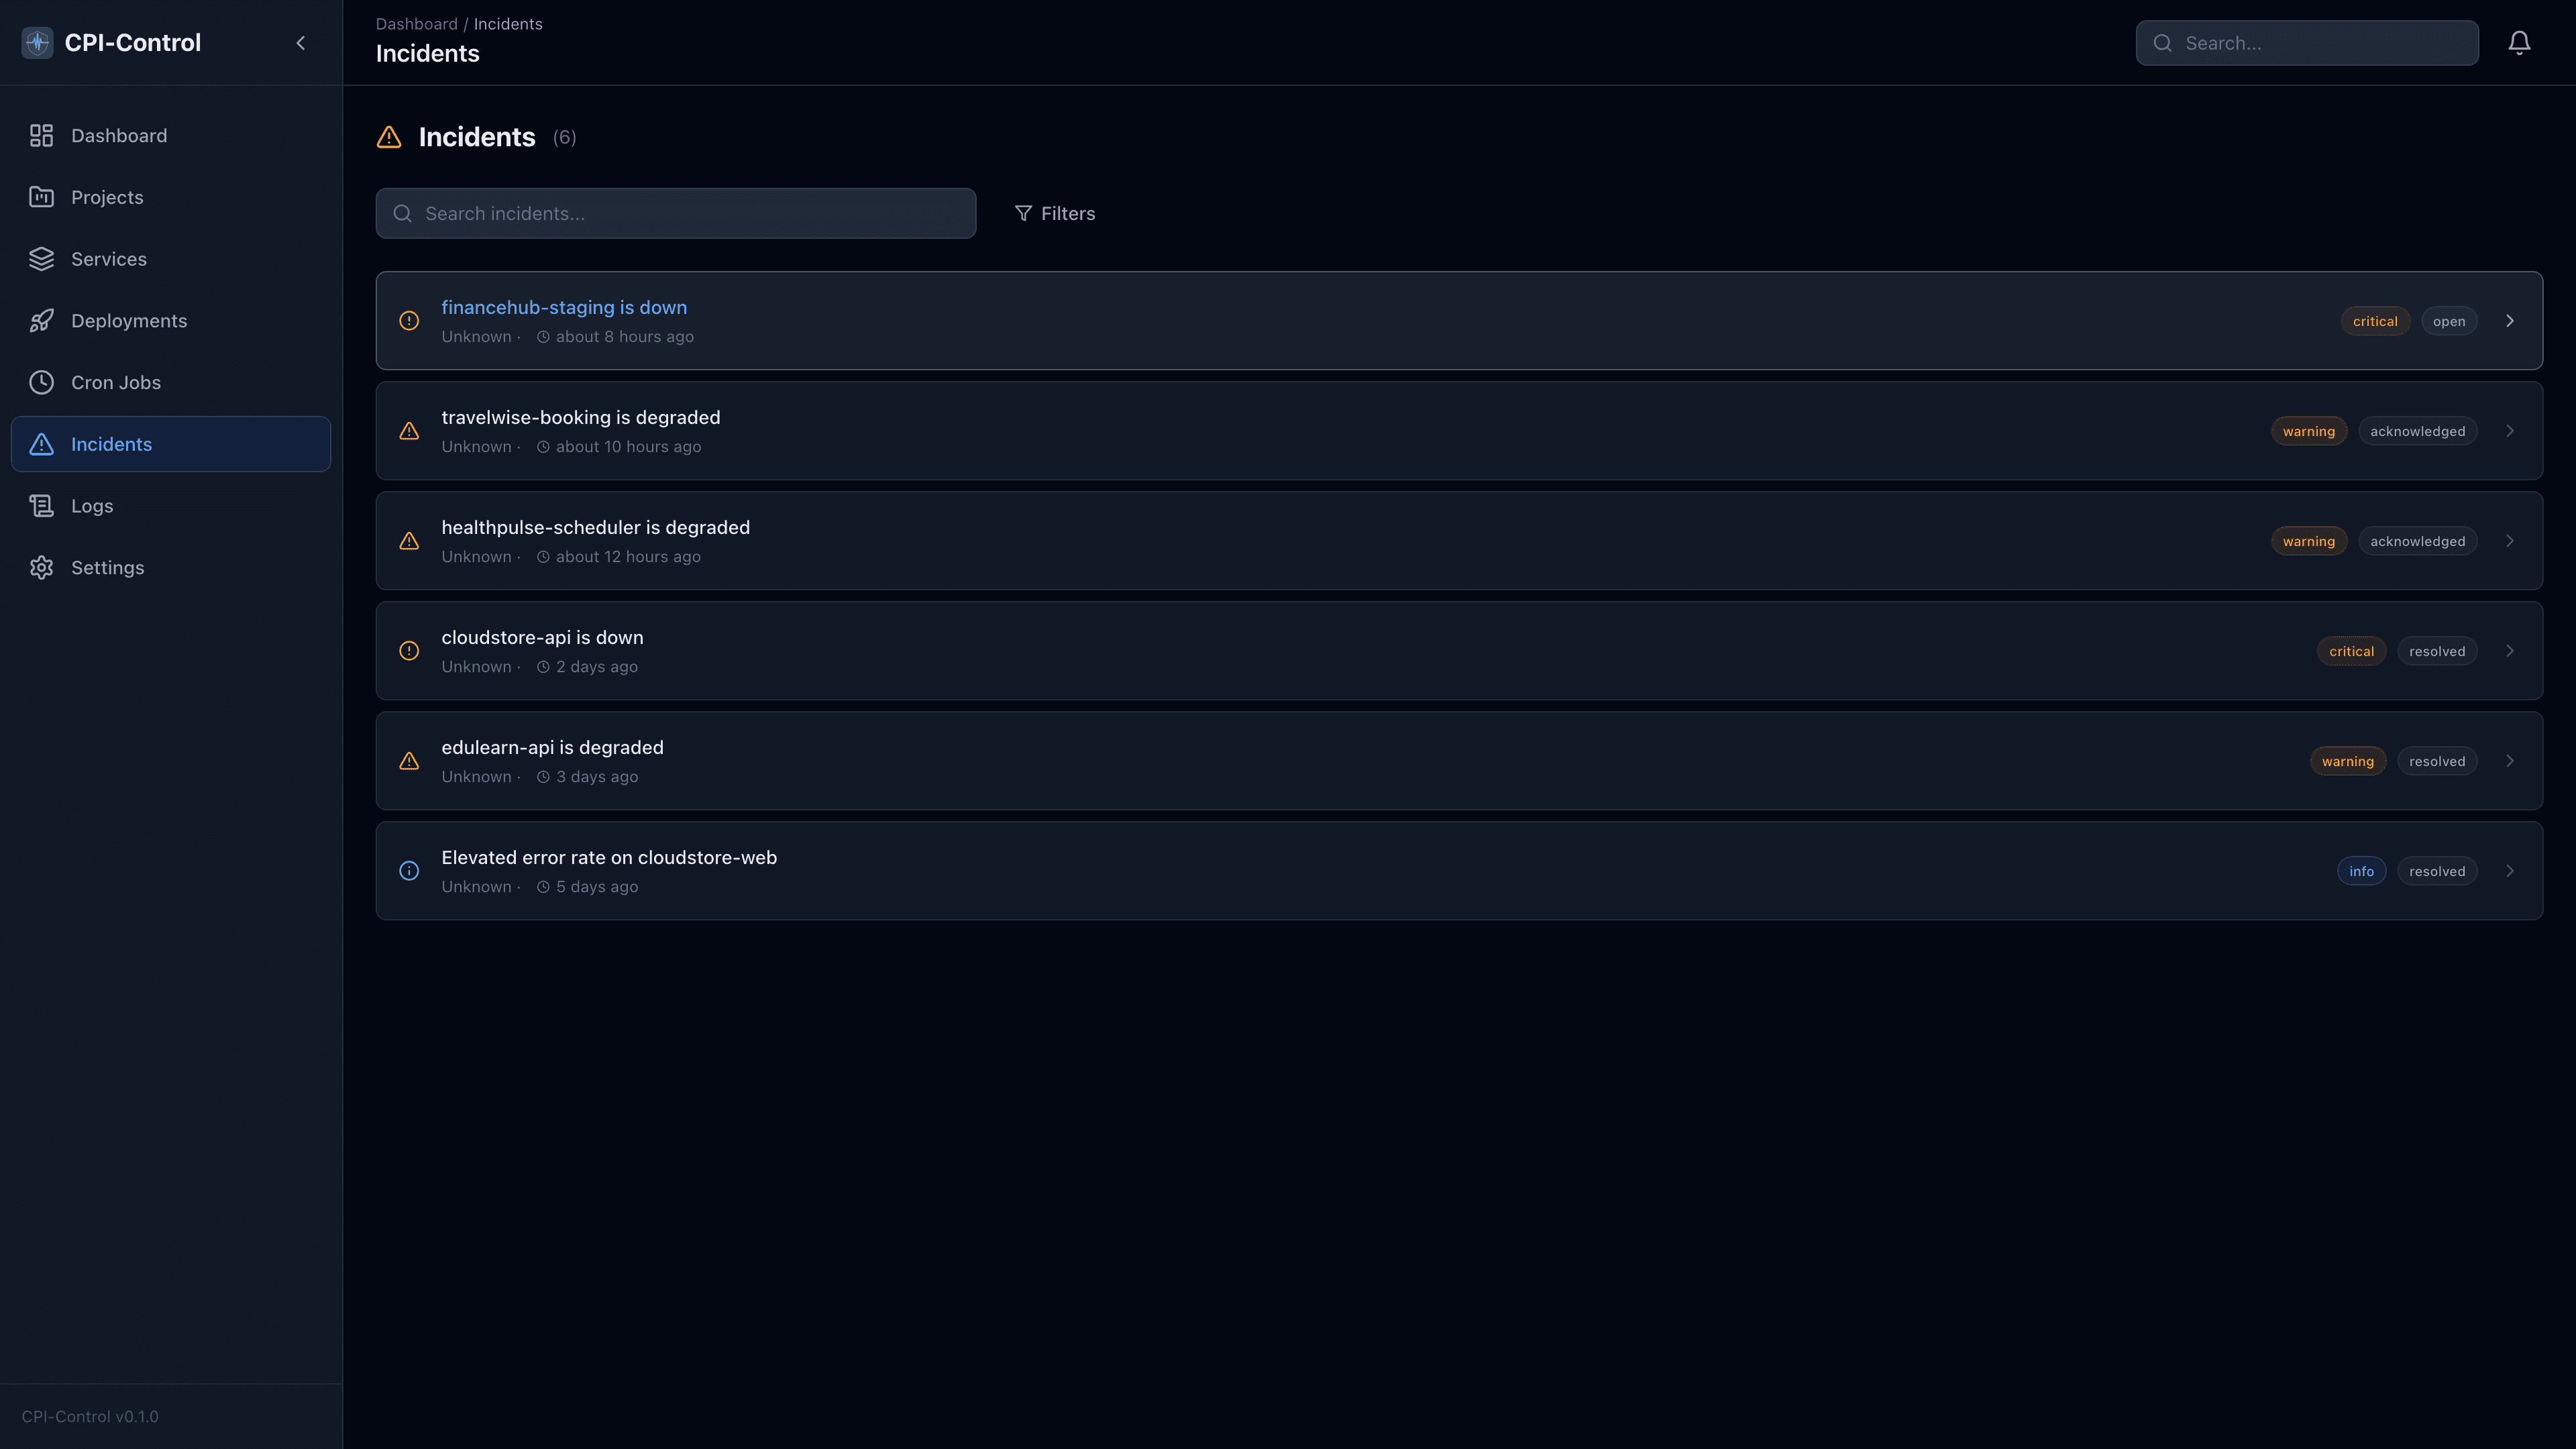
Set custom check intervals, timeouts, and expected status codes for each service. CPI-Control uses smart status mapping — a 404 response means the route exists and the server is healthy, while a 503 or connection timeout means the service is actually down.

  • Custom check intervals — from 30 seconds to 15 minutes
  • Configurable request timeouts per service
  • Expected status codes — define what "healthy" means for each endpoint
  • Smart status mapping — 404 = healthy, 503 = down, timeout = down
Health Check Config
https://api.example.com/health
60s
10s
200, 201, 204Healthy
404Healthy
500, 502, 503Down
TimeoutDown
Detection

Automatic Incident Detection

When a health check fails multiple times in a row, CPI-Control automatically creates an incident with full metadata — the HTTP status code, response body, response headers, and the exact timestamp of first failure. No manual incident creation, no missed outages.

  • Consecutive failure threshold — avoid false positives from single blips
  • Full response body captured for debugging
  • Response headers and status codes stored with each incident
  • Push notification sent immediately when an incident is created
Incident Timeline
Health check OKHTTP 200
14:30:00
Health check failedHTTP 503
14:31:00
Health check failed (2/3)HTTP 503
14:32:00
Incident createdHTTP 503
14:33:00
Notification sent
14:33:01
Recovery

Auto-Recovery

When a service comes back online, CPI-Control detects the recovery automatically and resolves the incident. The incident record is updated with the recovery timestamp and total downtime duration. A recovery notification is sent so your team knows the issue is resolved.

  • Automatic incident resolution when service recovers
  • Total downtime duration calculated and stored
  • Recovery notification sent to all configured channels
  • Full incident history preserved for post-mortems
Incident #127 — Resolved
Incident Started14:33:00 UTC

api-gateway returned HTTP 503 for 3 consecutive checks

Auto-Recovered14:41:00 UTC

Service returned HTTP 200 — incident resolved automatically

Total downtime8 minutes
Maintenance

Mute & Maintenance

Deploying a big migration? Doing scheduled maintenance? Mute individual services to suppress alerts without disabling monitoring. Choose timed mutes that expire automatically, or permanent mutes that stay until you lift them. No alert storms. No false pages.

  • Mute individual services — not your entire monitoring
  • Timed mutes — automatically expire after 15 min, 1 hour, or custom duration
  • Permanent mutes for services under long-term maintenance
  • Health checks continue running — data is recorded, only alerts are suppressed
Service Status
api-gateway
99.98%Healthy
payment-svc
99.95%Muted (15m)
web-frontend
99.99%Healthy
batch-worker
---Muted (perm)
auth-service
100%Healthy
Benefits

Why built-in monitoring wins

No Separate Tool

Health monitoring is built into CPI-Control. No Pingdom, no UptimeRobot, no additional SaaS subscription. One app, one dashboard, full picture.

GDPR-Compliant

All monitoring data stays on your local machine. No health check results are sent to third-party servers. No DPA required.

Correlated Context

When a service goes down, you see the latest deployment, the Kubernetes pod status, and the live logs — all in the same app. No tab-switching for context.

Monitor everything.
Pay nothing.

Built-in health monitoring for up to 50 services. No cloud account, no credit card, no data leaves your machine. Download and start monitoring in two minutes.

macOS 12+ (.dmg)Windows 10+ (.msi)~45 MBNo account needed