Kubernetes Management
Multi-Cluster
Kubernetes Management
Manage pods, view metrics, access terminals, and stream live logs across all your clusters — from one desktop app.
Manage pods, view metrics, access terminals, and stream live logs across all your clusters — from one desktop app.
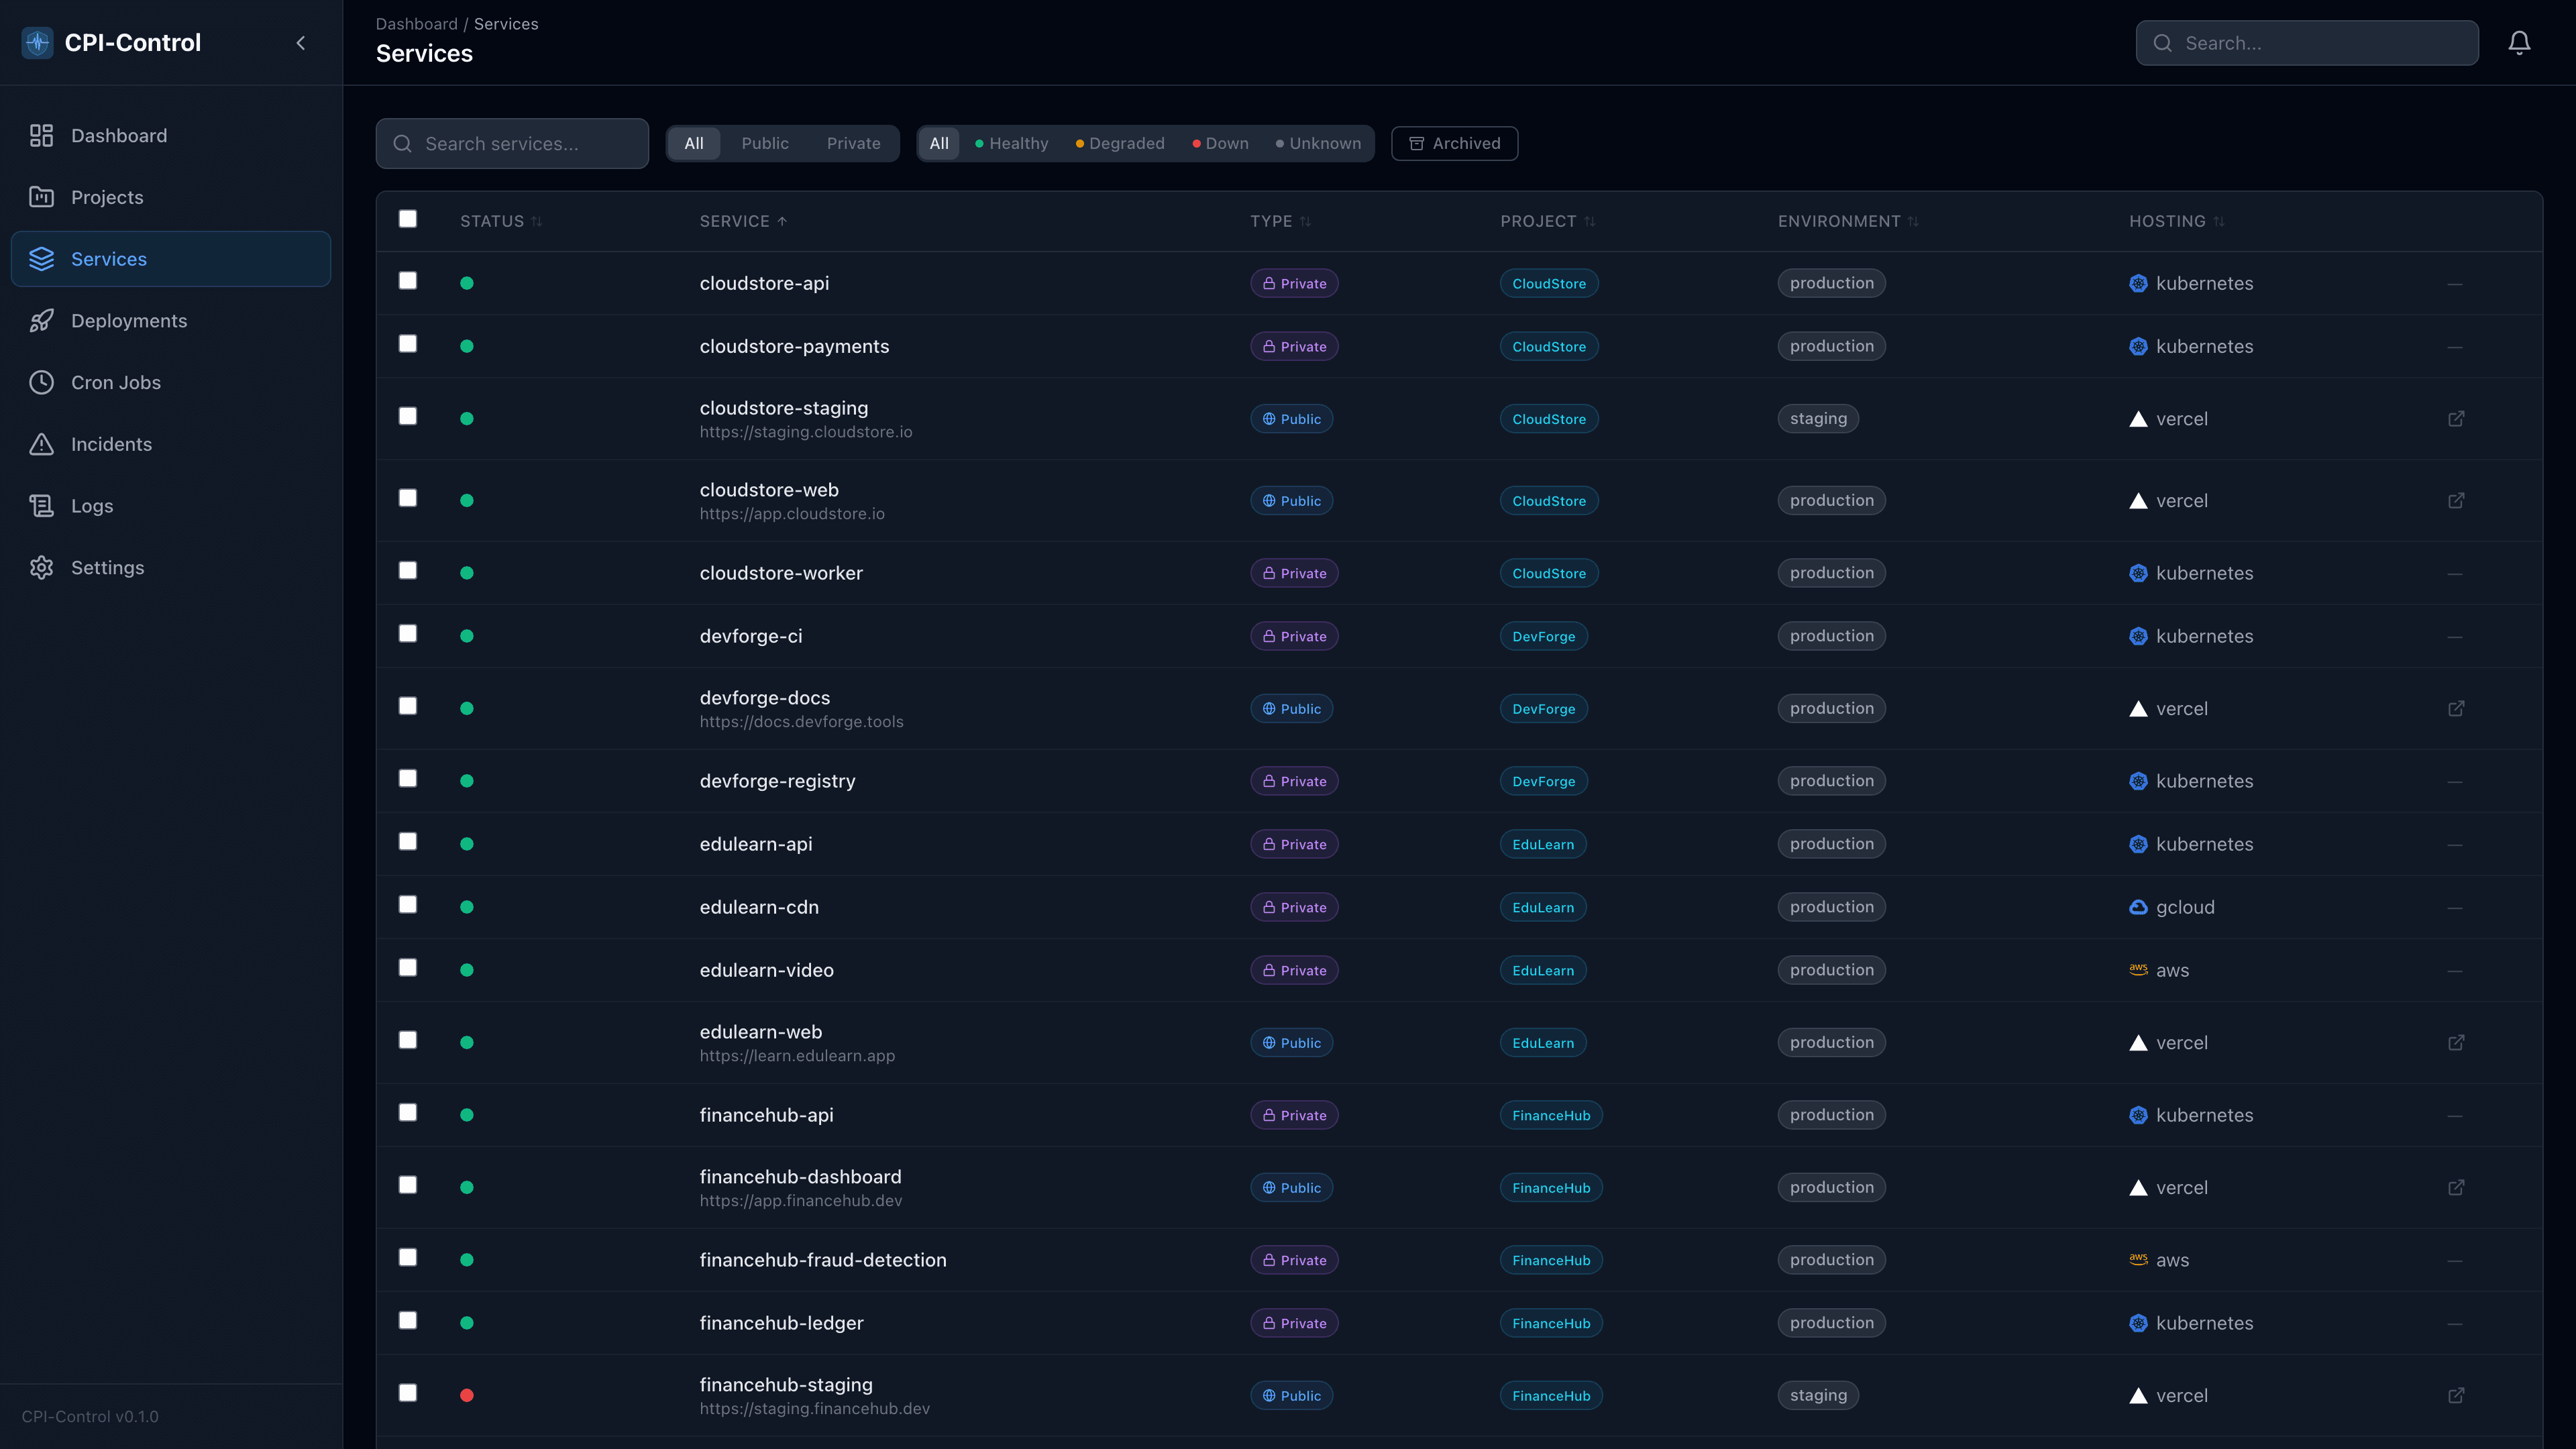
Upload multiple kubeconfig files and manage all your clusters from a single interface. Each cluster gets its own adapter with independent connection management, and all services appear in one unified list.
See CPU usage, memory consumption, restart counts, and pod age at a glance. Restart deployments, manage CronJobs, and open a terminal to any pod with a single click — no kubectl required.
CPI-Control uses stern under the hood to collect logs from every pod across every namespace. Logs are kept in an in-memory ring buffer and streamed live to your UI via Server-Sent Events — no Loki, no Elasticsearch, no cloud log ingestion fees.
Point CPI-Control at your cluster and it does the rest. Every namespace is scanned for Deployments, Services, and Ingresses. Public-facing services are identified automatically by checking for matching Ingress rules. No YAML, no annotations, no manual setup.
CPI-Control combines Kubernetes management with monitoring, deployments, and logs. Other tools only do one piece.
| CPI-Control | Lens Pro | k9s | |
|---|---|---|---|
| Multi-cluster support | Unlimited | 1 per window | 1 per session |
| Pod metrics | Built-in | Built-in | Built-in |
| Terminal access | One-click | Built-in | Built-in |
| Live log aggregation | Multi-service, stern | Per-pod | Per-pod |
| Health monitoring | Built-in HTTP checks | --- | --- |
| Deployment tracking | Multi-provider | --- | --- |
| Status pages | Built-in | --- | --- |
| Price | Free | $299/yr | Free |
| Non-K8s services | Vercel, GitHub, DO | --- | --- |
Download CPI-Control and connect your first cluster in under two minutes. Free for up to 50 services — no account required.